Exclusive: Consistent Velocity = Accuracy
Seems Right … But Is It True?
It’s been said consistent velocity produces greater accuracy. That is, the more consistent the velocity is between shots, the tighter the group. The more the velocity varies, groups will get larger. This makes intuitive sense. One would expect for bullets to hit the same spot, it’s more likely to happen if they are traveling at the same speed, or as close to the same speed as possible. The more consistent the speed, the more similar their trajectory.
The association of velocity and group size makes sense if you consider shots at a long distance where the bullet has significant time to drop from a straight path. Differences in velocity would result in bullets hitting high or low. Faster bullets would hit higher because they have a flatter trajectory. Slower bullets would hit lower because they have a more arced trajectory. The result is a vertical distribution of hits. More consistent velocity would produce less vertical dispersion, hence a smaller group.
Differences in speed also means differences in recoil and this means differences in muzzle rise. This could also produce a vertical distribution. Thus the effect of a wider spread of velocities can affect vertical stringing by two mechanisms, bullet drop and muzzle rise.
Differences in velocity can also affect the horizontal distribution. Bullets are subject to spin drift (i.e. the Magnus effect; gyroscopic drift), caused by their spin-stabilizing rotation from the rifling. Right-hand rifling causes bullets to drift right, and left-hand rifling causes bullets to drift left. However, the effect of spin drift is very small compared to bullet drop due to gravity.
Velocity differences can theoretically produce group size differences at long distance, but there might be other factors influencing accuracy. Even the Army Marksmanship Unit recognizes that, “Extremely uniform velocities alone are ‘not’ a reliable predictor of accuracy!”
Velocity
What About Handguns?
Does consistent velocity affect group size for the typical handgun at typical handgun distances? For this article, the typical distance will be defined as 25 yards. I suspect of the bazillion rounds or so shot every year from handguns, only a small percentage are fired past that distance.
Another question is whether the typical handgun’s accuracy potential can distinguish between differences in velocity. That is, is the gun capable of such precision shooting its mechanical imperfections won’t overpower velocity effects? Thus the gun’s capabilities become another variable in the equation.
Ammunition is another variable. Not all ammunition is equally accurate, and even the most accurate ammunition might be subject to variations in precision independent of velocity effects. Even if every round fired had exactly the same velocity, they might not end up going through the same hole in the target. There are multiple variables affecting group size from the typical handgun. Bullet drop and spin drift might be minor effects compared to other factors.
Let’s take a quick look at how much bullet drop and spin drift can effect handgun ammunition with typical variances in velocity. I used the ballistics software at www.jbmballistics.com to estimate bullet drop and spin drift effects for the ammo I tested based on my actual chronographed values. I selected the group having the widest extreme spread of velocities to estimate the amount of dispersion for which these factors could account. I used two bullets, a 115-grain Zero JHP and a Nosler 124-grain JHP.
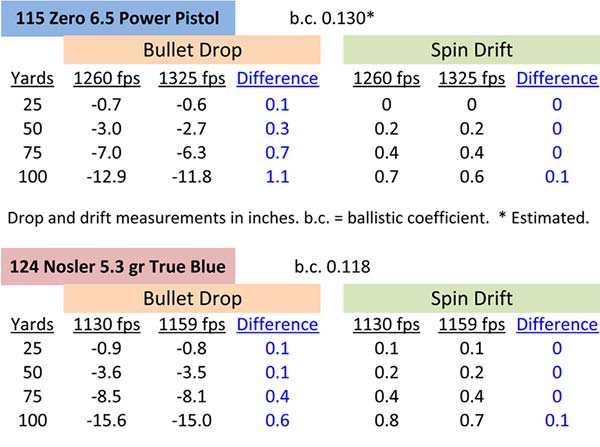
Calculated bullet drop and spin drift effects for the ammunition that was tested.
It’s not certain this estimation program is appropriate for handgun bullets since it targets rifle bullets, but let’s look at the numbers anyway, we may learn something. The table shows calculated values for drop and drift out to 100 yards. Bullet drop at 100 yards for the 115-grain bullet was around 12″. However, the estimated difference in bullet drop between the high and low speeds was a mere 1″. That’s not much. And the estimated difference at 25 yards was a tiny 0.1″. Spin drift estimates for this bullet are just over half an inch at 100 yards, and only differ by 0.1″ between the high and low speed bullets. At 25 yards, spin drift does not even reach a tenth of an inch, and the difference in spin drift between the fast and slow bullets is essentially nothing. Estimates of bullet drop and spin drift for differences in the speeds of the 124-grain bullet produce similarly small differences at 25 yards.
If bullet drop and spin drift affect group size by such a small amount, do velocity variations matter when the group is larger than what is predicted? What if a 25 yard group is 1″ across, or 2″? What if velocity variations affected group size by other mechanisms. How would we know? Simple. See if velocity consistency and group size are statistically correlated. If they are, then they are linked even if we don’t know the details of the mechanisms.
Variables And Consistencies
There are several circumstances where we might try to apply the concept of consistent velocity and accuracy. These include: 1) same bullet, different gunpowders; 2) same gunpowder, different bullets; 3) different bullets, different gunpowders; 4) same bullet, same gunpowder, different charge weights. While these are all scenarios of interest, they have more than one variable that can affect the outcome.
A more straightforward approach is to test consistent velocity and accuracy with the same gunpowder, same bullet and same charge weight. If more consistent velocities produce tighter groups, it should be evident when you compare multiple strings of fire. The strings with the smallest groups should have the smallest deviations in velocity.
I tested this concept with a typical handgun at 25 yards. I call it a typical handgun because it’s not a match-grade ultra-tight-fit gun. It is ammo sensitive, shooting some ammo like a dream, but other ammo like a nightmare. I consider 25 yards an adequate distance for this test, since most all handguns will produce a dispersion of shots at that distance, and this pistol certainly does that.
We’re looking for a positive correlation between group size and the variation in velocity. Evaluating the data consists of performing a Pearson correlation coefficient statistical test comparing group size to the standard deviation of the velocity. If the hypothesis is true that more consistent velocities result in greater accuracy, then smaller groups should be positively correlated with smaller standard deviations in velocity. Standard deviation is a measure that quantifies the variation or dispersion of the velocities in a set of data.
We can also use the extreme spread of velocity instead of the standard deviation in the correlation test because they are both measures of the same phenomenon — variation in velocity. Just to be thorough, a correlation test was done with both velocity measurements against group size.
A correlation can be positive or negative. A positive correlation indicates the variation in velocity and group size both go in the same direction — they both increase or both decrease. A negative correlation means they go in opposite directions — as the variation in velocities increases, the group size decreases.
Correlation values range from 1.0 (positive) to -1.0 (negative). The size of the value determines whether the relationship is real or random, and the cutoff value depends on how many measurements are compared (sample size, which in this case is the number of groups (strings of fire)). If the critical value for a statistically significant correlation is 0.50 (hypothetical example), then a correlation value (denoted as “r”) between 0.50 and 1.0 means there is a statistically significant positive correlation between group size and velocity variation. That is, smaller velocity variations are likely responsible for smaller groups. If the correlation value is between -0.50 and -1.0, it means there is a statistically significant negative correlation between group size and velocity variation. That is, that smaller velocity variations are likely responsible for larger groups. A correlation value between -0.49 and 0.49 means there is no statistical relationship between group size and velocity variation, so velocity variation does not have anything to do with group size.
Correlations
A correlation between two things does not necessarily mean they are causally related. A classic example is that geese fly south, and children return to school, in the fall. They are correlated because they happen at the same time, but one does not cause the other. However, in our case, we are assuming a causal relationship between velocity variance and group size: groups are smaller because the bullets have more consistent velocity.
A one-tailed test criterion was used because I’m specifically testing for a positive correlation between the standard deviation in velocity and group size. A one-tailed test is more sensitive (than a two-tailed test) and more likely to be statistically significant, to claim that consistent velocity and group size are related. A 0.05 probability was used. This means if the correlation value is statistically significant, there is at least a 95 percent chance the test accurately assess the relationship between consistent velocity and group size.
I designed the test to use a large sample size. A large sample size gives you more confidence you’re giving a phenomenon a chance to prove itself. I have many comparisons with relatively small samples sizes of two to five groups, and most of them show there is no correlation between consistent velocity and group size (all handgun data from the gun mounted in a Ransom Rest). Some examples have a positive correlation, and some have a negative correlation. The statistical results are all over the place, suggesting small sample sizes are a poor metric of this phenomenon, or that any statistically significant result occurs merely by chance, or it might depend on which powder and bullet combinations you compare. Any of those explanations could be true. In any case, a larger sample size is more rigorous, and if nothing else, it makes the experimenter feel the odds of a false conclusion are less likely.
To hedge my bets against reaching a false statistical conclusion, I did two experiments. The second experiment used a different gunpowder and bullet. While this does not guarantee no statistical error, it decreases its probability..
How many shots should be in the group? Five? Ten? Twenty? Fifty? I don’t think there is a magic number as long as both the group sizes and velocity spreads have enough variation they don’t look the same and are statistically distinguishable. For example, if all the groups measure the same size, then the variation in velocity can’t distinguish between them. I used 15-shot groups. One load had a 2.0-fold deviation in velocity extreme spreads and a 2.8-fold deviation in group size. The other load had a 1.9-fold deviation in both velocity extreme spreads and group size.
The Loads
Two 9mm loads were used. The first was a 115-grain Zero JHP bullet loaded with 6.5 grains of Power Pistol and CCI 500 primers loaded to 1.115″ overall length in new Starline brass. The second was a 124-grain Nosler JHP bullet loaded with 5.3 grains of True Blue and Federal Match primers to 1.110″ overall length in new Lapua brass. Nosler notes this True Blue load was the most accurate one tested with this bullet, though they loaded it to 1.120″ overall length and in Winchester brass.
The Zero bullet load consisted of 300 rounds fired in 15-shot groups, for a total of 20 groups (strings of fire). The barrel was cleaned at 75 round intervals, and 10 rounds were fired after cleaning to condition the barrel before firing the next 75 rounds. The Nosler bullet load consisted of 180 rounds fired in 12 consecutive 15-shot groups.
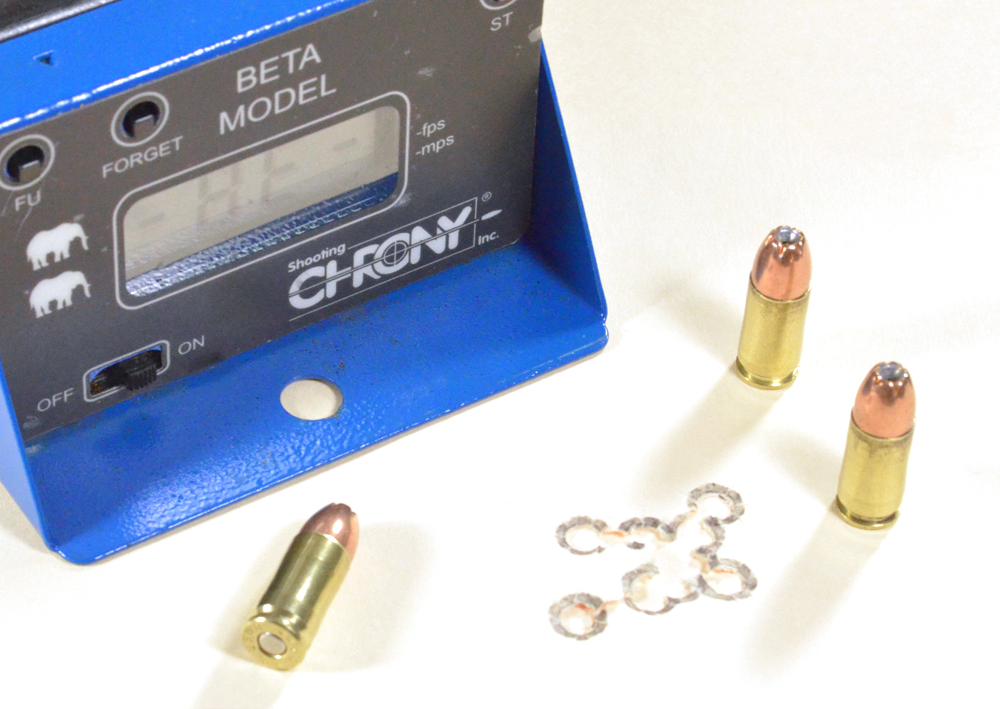
The test gun was a 1911-type pistol with a Para Ordnance frame, a Caspian slide and a 5″ Kart 9mm barrel. The gun was fixed in a Ransom Rest and groups were fired at 25 yards. Velocity was recorded with a Shooting Chrony chronograph at about 10 feet.

The gun was fired from a Ransom Rest to eliminate human-induced
shooting errors such as flinching and inconsistent sight alignment.
Results
The statistical test found no positive correlation between velocity consistency and group size. Smaller deviations (or smaller extreme spreads) in velocity did not produce smaller groups. In fact, the correlation statistics were slightly negative. The fact that all correlation coefficients were negative might suggest it’s more likely velocity spread and groups are negatively related, i.e. small spreads in velocity are linked with larger groups. However, this would not be a fair statement. The negative correlations were small and would not have reached statistical significance even if we were looking for a negative correlation. Non-significant statistical results only mean that velocity variations and group size are not correlated.
Here are the details:
The 115-grain Zero bullet produced an average 15-shot group size of 2.08″. The smallest group was 1.07″ and the largest was 3.02″. In order for the 115-grain Zero load (N=20, 18 degrees of freedom) to reach statistical significance, the correlation coefficient had to be at least 0.3783. It did not reach this value, indicating consistency of velocity and group size are not related. The correlation value between velocity standard deviation and group size was -0.1306, and the correlation with group size and velocity extreme spread was -0.1562.
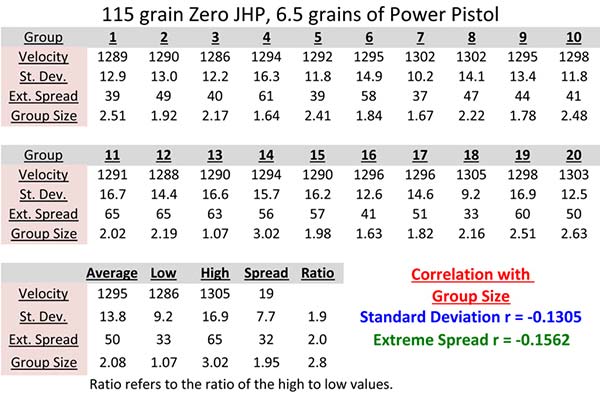
Data from the test with 115-grain Zero bullets and Power Pistol. The correlations between group
size and velocity measurements (standard deviation and extreme spread) are negative.
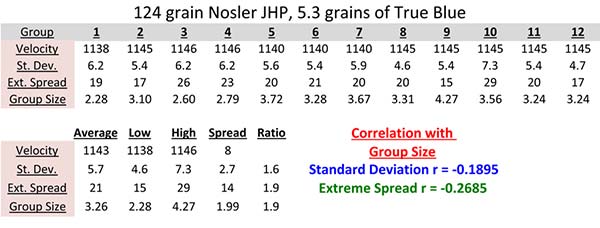
The Nosler bullet load produced larger groups, on average, than the Zero bullet. It’s average 15-shot group size was 3.26″, with the smallest group at 2.28″ and the largest at 4.27″. The statistical results with the Nosler 124-grain load (N=12, 10 degrees of freedom), like the Zero bullet, were not statistically significant. The critical value of “r” for this sample size is 0.4973, but the correlation between velocity standard deviation and group size was -0.1895, and the correlation with group size and velocity extreme spread was -0.2686.
Velocity Table 3
Data from the test with 124-grain Nosler bullets and True Blue. This data is just like the 115-grain bullet data: the correlation values are negative. Smaller deviations in velocity were not positively correlated with smaller group sizes.
Velocity Table
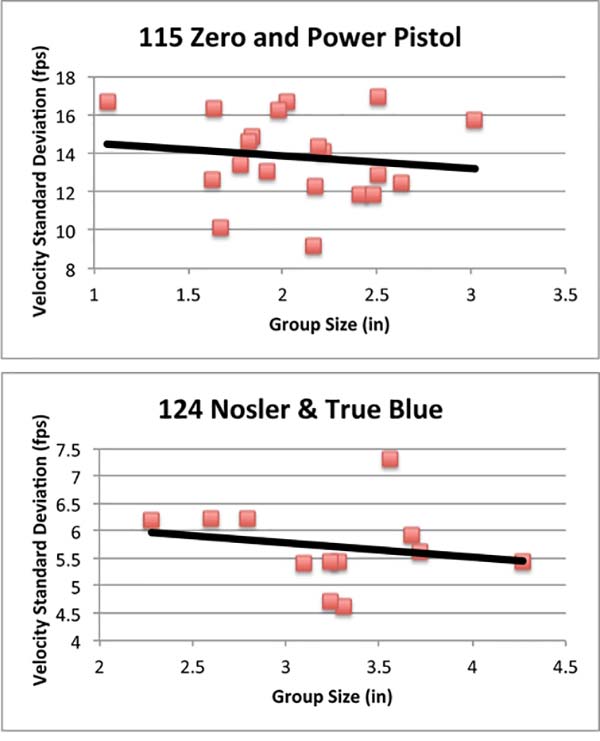
Scatter plots of group size and velocity standard deviation for both bullets. The angle of the black trend lines tilt lower to the right, which indicates the slightly negative correlation between these two variables. If the correlation was positive, the trend line would tilt upward to the right.
Summary
The results of this experiment found no evidence to support the claim more consistent velocities produce smaller groups. This suggests we don’t need to fret over the consistency of the velocities with respect to accuracy for the typical pistol at typical pistol distances. The results might be different with a precision pistol or simply a barrel locked in a test fixture. Even under these conditions, this hypothesis would need to be tested to see if it holds up.
These results don’t come as a surprise to me because of my other Ransom Rest data. If a positive correlation between velocity spread and group size was a robust phenomenon, I would have many examples of it in my data. I don’t. There are some examples of this, but they are random, not robust. There are likely too many other factors involved that contribute to accuracy, or its degradation.
The calculated estimate of bullet drop and spin drift with my ammunition accounted for a group spread of 0.1″ at 25 yards (if the software is appropriate for handgun bullets). This is a very small portion of the actual group sizes which ranged from 1″ to 4″, indicating other factors contribute to the distribution of hits.
These results demonstrate when testing for accuracy, we should focus more on the distribution of hits on the target, and less on the distribution of velocities over the chronograph. The real proof of accuracy is how well they group, and not the consistency of their speed. Chronographs measure velocity, and targets measure accuracy. Trust the target, not the chronograph.
Resources: https://www.jbmballistics.com/cgi-bin/jbmtraj_drift-5.1.cgi
References:
(1) Accuracy and Chronograph Testing, Part 8. U.S. Army, Army Marksmanship Unit, Custom Firearms Shop. Shooting Sports USA. Online publication. October 7, 2016. https://www.ssusa.org/articles/2016/10/7/accuracy-and-chronograph-testing-part-8/