"Load/Accuracy Charts Are A Waste Of Time!"

After firing 35, 5-shot groups through his early S&W M&P, all Duke learned was it shot Remington 148-gr.
wadcutter loads pretty good. On average and with that particular lot of ammo!
At times readers ask me, “Why doesn’t Handgunner have many load or group charts?” My response is, “Because we think they are next to worthless.” That always brings a frown because many readers think those figures encompassed in a chart are carved in stone.
A load/accuracy chart shows what one gun did in the hands of one person in one weather condition, with specific lots of ammunition. Variables abound! For any chart I put together, the firing here on my Montana property will be at 5,000 feet, will likely be at sub-30 percent humidity, temperature under 70 degrees and almost assuredly in at least 10 mph winds. Give another writer the same handgun to fire at sea level in 90 percent humidity at 90 degrees, in dead calm and our results are not going to be the same.
Even different lots of powder, primers and factory bullets are variables. Factory ammo lots certainly vary. I’ve had factory 250 grain .45 Colts clocking near the advertised 860 fps and other lots of the same brand averaged about 750 fps. All were fired from the same .45 revolver. All a chart might give you is a rough idea — but even that just applies to that one situation.
And the biggest variable of all is that a single handgun drawn from a manufacturing run of thousands may be the best one made. Or it may be the worst one. Yours may be in the middle. Many readers think we writers get hand-picked samples. Maybe some do. I don’t think the industry in general values ’ole Duke’s opinion enough to care because I’ve received test samples with serious problems. One single-action revolver arrived with no rifling in its barrel. A 5-shot, double-action revolver loaned to me would not fire a cylinder full without a misfire.
A Big Grain Of Salt?
At a Montana gun show one time a reader debated the idea of load charts with me, saying, “But a load chart proves the writer test-fired the gun. It contains velocities and often group sizes.” All it proves, to me, is those figures are in the chart.
Once I asked another writer, whose veracity I consider 100 percent, what he thought of a particular writer’s extensive load chart. To me the group sizes seemed far too consistent. He told me to look at a certain reloading manual, then add “7” to its velocity figures for the same loads that guy had listed. Sure enough, the fellow I doubted had simply copied velocity numbers from a manual and added seven fps to each. Rest easy though, as His Editorship would fire us instantly if we ever tried to pull anything like that! Which we wouldn’t, regardless!
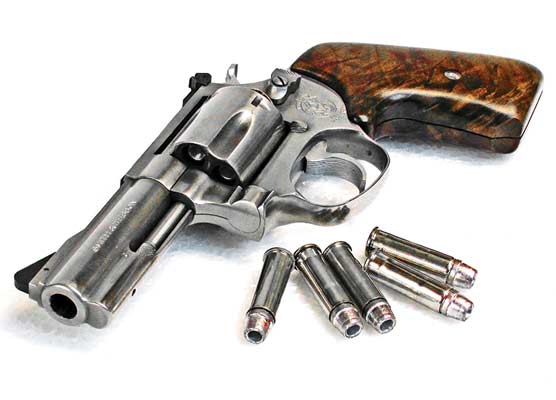
For the group sizes in a load chart to mean anything, there must be many shots with each factory load or handload combination. One time, I put my late 1940s vintage Smith & Wesson Military & Police .38 Special in a machine rest for an experiment. Remington generously furnished me a quantity of their excellent 148-grain wadcutter load. I fired five, 5-shot groups at 25 yards from each chamber loading one round at a time. Then five, 5-shot groups using all chambers. One at random wasn’t used each time the revolver was loaded.
At the end I had 35, 5-shot groups from one revolver with one factory load. The total average was only about 1.2″. My point was to determine if one chamber was significantly capable of better precision than the others. It didn’t happen! What all that work proved to me was my old .38 was a superb shooter and Remington’s 148-grain factory ammo was excellent. At least that lot was.

Two revolvers, two different chamber mouth measurements. What good would seeing an
accuracy chart of loads fired in one do for the guy who owns the other revolver?
Be A Skeptic
What to beware of when reading load charts is amazing consistency. Before I entered the business I’d look at test results in The American Rifleman magazine. They would shoot a string of five 5-shot groups from handguns, with several loads and list smallest group, largest group and the average. Often their largest group was several times larger than their smallest. I’d think, “What’s wrong with those guys? Why are their groups so inconsistent?” It was because their staffers were telling the truth. I learned that after buying machine rests and doing my own testing. If you’re looking at a wide range of loads, then groups are likely going to often be significantly different. If they’re not, I’d be suspicious of the results.
So what I do when getting a new fixed sight handgun is try it for point of aim versus point of impact with a small variety of factory loads or favored handloads. If it’s adjustable-sighted, then I shoot it enough to get it zeroed. Both autoloaders and revolvers are checked for reliability with a couple hundred rounds. Then I try to spend enough time with it to actually hit something with it instead of just trying to make miniscule groups.
Read all the charts you want, but keep in mind the info may not apply to you or to the real world at all. The only chart to really trust is one in a legitimate loading manual. But even then, only use current loading info, not something from a 50-year-old manual!